

• Not a Deposit • Not FDIC Insured • Not Insured by Any Federal Government Agency
15-Minute Article
2026 Outlook and the Wealth Killers
2025 Has Been a Good Year.
Written by: Phil Melville, Chief Risk Officer at Brighthouse Financial
2025 has been a good year financially overall. Looking first at the U.S. economy, U.S. gross domestic product (GDP) increased 4.3% on an annualized basis in the third quarter of 2025, up from 3.8% in the second quarter. The growth in the third quarter was driven by increases in consumer spending, net exports, and government spending, contributing 2.4%, 1.6%, and 0.4%, respectively. Imports declined again in the third quarter but had a smaller impact on the GDP results compared to the second quarter. Investment spending subtracted 0.1%. The Consumer Price Index (CPI) ticked up in September 2025 to 3% year over year, up from 2.9% in August.
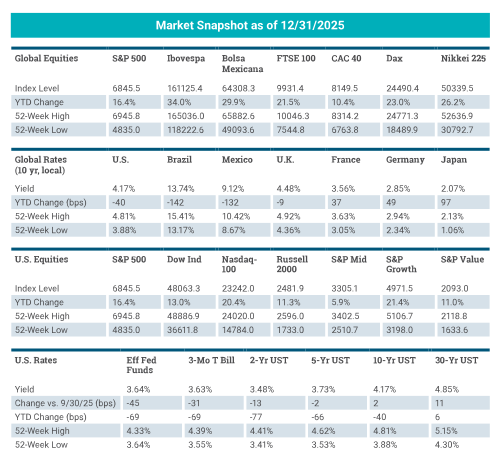
In April 2025, asset markets fell after the Trump administration announced sweeping tariffs but rebounded sharply after tariffs were softened and some trade agreements were reached. The passage of the One Big Beautiful Bill Act (OBBBA) by Congress also helped to stabilize investor sentiment. In 2025, on a price basis, the S&P 500® Index returned 16% while the Nasdaq-100® Index and the Russell 2000® Index returned 20% and 11%, respectively. Emerging markets performed strongly as well, returning 31% for the year. The Bolsa Mexicana was up 16% for the year, though down 3% in the fourth quarter. Developed markets outside of the U.S. have also performed well in 2025, aided by overall strong quarterly returns with the FTSE 100, CAC 40, and Nikkei 225 returning 6%, 3%, and 12%, respectively. Across the U.S. Treasury yield curve, the 3-month Treasury Bill rate fell 35 basis points to 3.67% while the 10-year Treasury was up 2 basis points to 4.18% in the fourth quarter. Also worth noting, corporate spreads have remained relatively tight throughout the year, signaling belief in a benign economic and market environment.
Market Snapshot as of 12/31/25
Source: Bloomberg
2026 Outlook
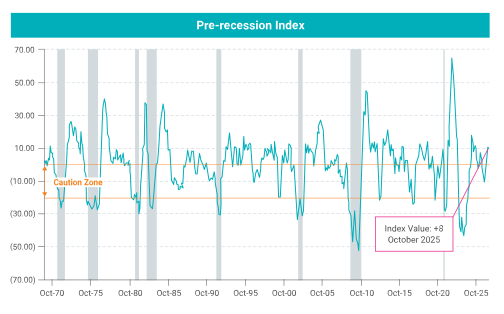
The economic and market outlook for 2026 is relatively benign, although there are some risks to the outlook. Based on the latest reading of the Brighthouse Financial proprietary pre-recession index (see below), the probability of a recession in 2026 is roughly 25-30%, with the consensus estimate at 30%. However, the probability of a recession in any year is approximately 15% based on the historical occurrence of recessions over the past century. Therefore, the current probability is slightly elevated.
Recession probability is low
Sources: Bloomberg, Macrobond
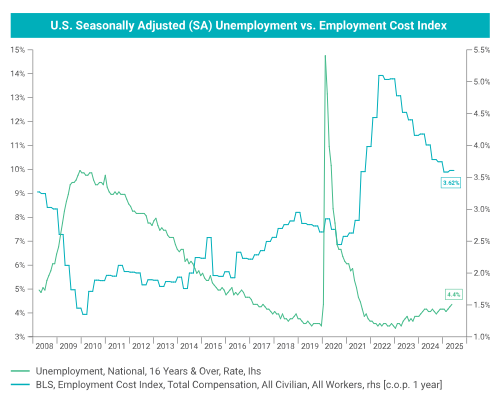
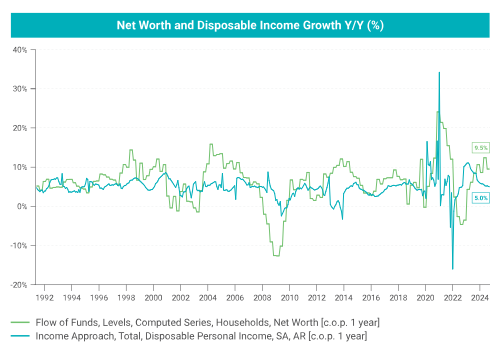
The consensus GDP growth estimate for 2026 is 2.1%, slightly higher than our internal 2026 estimate of 2%. We believe solid growth is supported by a consumer sector that accounts for almost 70% of U.S. GDP, with unemployment still relatively low at 4.4%, while household wealth grew by 9% year over year thanks to a strong stock market with disposable income growing by almost 5% year over year – that’s the good news.
Unemployment is still low with incomes growing modestly
Source: Macrobond
Net worth and disposable growth still strong
Source: Macrobond
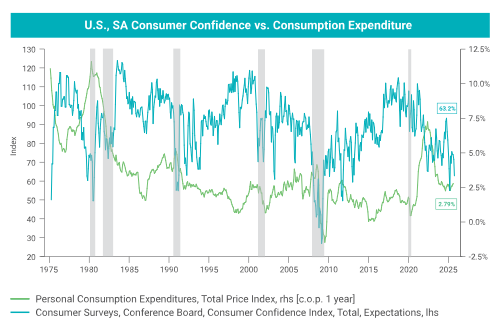
The bad news is that surveys of consumer confidence show that the U.S. consumer is not happy, and this may be due in part to pressures that are building on both the labor and inflation fronts. There have been signs of weakness as job openings have dropped, the average duration of unemployment has increased, and wage growth has slowed. Kraft Heinz recently warned of the worst U.S. consumer sentiment they have seen in decades.1 Amazon, Target, UPS, and others have announced large job cuts, with Amazon’s cuts of 14-30K jobs mostly comprising higher paying white-collar jobs.2 Challenger, Gray & Christmas have tracked roughly 1M job cuts this year – up over 54% versus last year and the highest total since 2020, when over 2M job cuts were made.3 If the labor market weakens even more in 2026, spending will likely also fall and growth will drop as well.
Confidence is falling and expenditure growth is weak
Source: Macrobond
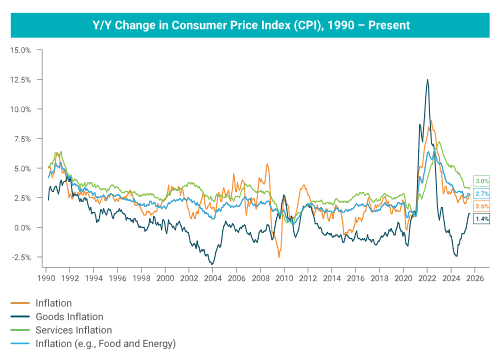
We continue to believe there is also a risk of inflation being higher than expected in 2026 due to tariffs as companies pass price increases to end consumers. Though headline inflation unexpectedly slowed in November to 2.7% compared to 3% in October, the data indicates a sharp upswing in goods prices to a 1.4% year-over-year rate versus a negative rate several months ago. Other components of inflation are also moving higher or remain at a high rate; for example, services inflation in the last reading in November 2025 was at 3% year over year, but once again unexpectedly down from 3.5% in October 2025. Given the underlying data and looking ahead in 2026, the consensus estimate of 2.9% inflation is a bit too low, in our opinion, and our internal estimate is for inflation to run hotter at 3.2% year over year. There are three factors that could offset higher inflation. One factor is the softer labor market – as service costs tend to be sticky, a significant weakening in the labor market could lead to lower service inflation. Although this is not our base case, it’s something to monitor in 2026. The second factor is the noted deflation in China that could feed through to lower inflation of goods, even in the face of higher tariffs. The third factor is housing prices and rent costs, as real estate prices have softened and apartment supply has spiked, with more incentives being offered to renters.
Source: Macrobond
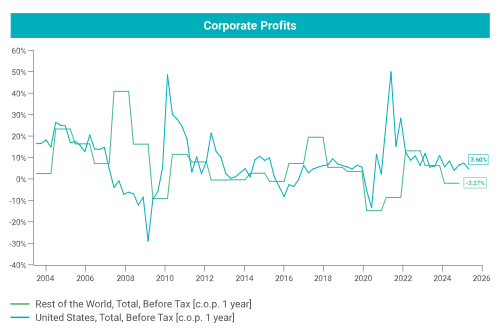
Another risk to the economy we see is that profit growth is slowing. We take the broadest measure of profits across the U.S. economy, not just S&P 500 Index profits. What we’re seeing is a slowdown in profits to a roughly 4% year-over-year growth, down from a 6% rate earlier in the year. A slowdown in profits is usually met with cost cutting, which often means layoffs and could feed into a worsening labor market, as mentioned above. With large investments being made in artificial intelligence (AI) and AI-related infrastructure with little associated profit, the implication is that such investments must be funded with cash or debt. While the collective balance sheet of U.S. companies investing in AI is relatively strong and cash-rich, a slowdown in AI spending coupled with slowing profits could point to lower GDP growth.
Corporate profits growth rate is slowing
Source: Macrobond
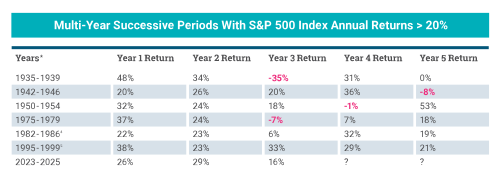
Fortunately, a stable macroeconomic environment, despite the risks we see, should support solid asset market returns in 2026. We expect modest equity market returns in 2026 following a strong year in 2025, with the S&P 500 Index up about 14% year to date. Our internal estimate is for a more modest 5% return for the S&P 500 in 2026, while the consensus estimate is 7.3%. Historical returns provide no clear guidance on future returns, but there were three significant periods when the S&P 500 had double-digit positive returns for several consecutive years: 1942-1946, 1982-1986, and 1995-1999. Double-digit equity returns from 1995 to 1999 were followed by three consecutive years of negative returns from 2000 to 2002, as shown in the table below.
Source: Bloomberg
* Period starts on January 1 and ends on December 31
* Period starts on January 1 and ends on December 31
Looking at interest rates, the Federal Reserve (Fed) raised the federal funds rate 525 basis points from March 2022 to July 2023 and cut rates by 100 basis points in 2024. In 2025, the Fed cut rates by 25 basis points each in September, October, and December. The futures market is currently pricing in roughly two more rate cuts in 2026. These market expectations have been volatile due to uncertainty about inflation and economic growth. We expect that uncertainty to diminish somewhat in 2026. For year-end 2026, our internal estimate for the U.S. 10-year Treasury interest rate is 4.00% compared to the consensus forecast of 4.17%. We believe there is downside risk to this estimate of 25-40 basis points if the labor market and inflation downside risks we see materialize.
If equity market returns are positive in 2026, we expect investment-grade and high-yield credit spreads to remain range bound in 2026, reflecting a benign default environment. Of course, there are likely to be bouts of volatility as we have seen each year, but overall, we expect a stable economic and market environment for 2026, with noted possible risks from a weakening labor market, weaker profits, and higher inflation.
The Wealth Killers
While the short-term outlook for 2026 is positive overall, there are three main deep-rooted issues that the economy and markets will have to face over the next decade. Unfortunately, these factors can be true “wealth killers” for those at or close to retirement. These issues are as follows:
- Over-valued equity markets and the potential for a sharp market correction
- Inflation
- Taxes
Wealth Killer I: Over-valued markets and the potential for a sharp market correction
One of the worst things that can happen to someone close to retirement is for a sudden sharp drawdown in the equity markets to negatively impact their portfolio.
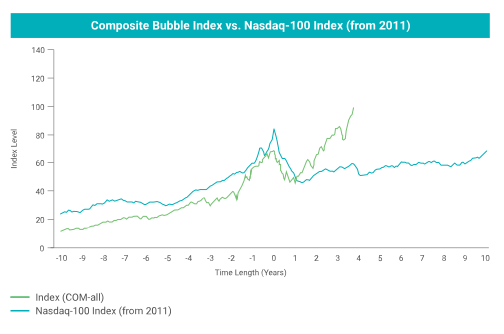
Unfortunately, we believe the risk of a drawdown in the equity markets has risen sharply since 2022. The chart below shows our proprietary Bubble Index, which benchmarks the price movement of a particular index. In this case, the Nasdaq-100 Index is compared to the Bubble Index, which tracks assets that have been appreciating sharply and then have fallen sharply. For example, the Bubble Index includes historical markets such as the equity market bubbles that burst during the Great Depression (1929), the Gold Crash (1980), the Japanese Asset Price Bubble (1991), the Great Recession (2008), and the Dot-Com Collapse (2000), among many other similar incidents across multiple regions and asset classes.
Nasdaq-100 Index looks like it is in a bubble
Sources: Brighthouse Financial, Bloomberg, Macrobond
We believe the Nasdaq-100 Index is currently in a bubble due to the dominance of AI and technology stocks. The Nasdaq-100 had previously exhibited signs of a bubble, and that bubble burst in the stock market correction of 2022 as the Federal Reserve sharply raised interest rates. Unfortunately, the Nasdaq-100 has rebounded very quickly and is again exhibiting signs of being in a bubble. The parallels between the dot-com bubble of the late 1990s and the AI bubble of today are quite close. In both periods, there were numerous unprofitable companies with high-equity market valuations, an over-reliance on debt funding for key infrastructure spending on build-outs, and the use of off-balance sheets/nonrecourse debt for companies investing heavily in the new technology.
No one knows what will cause the Nasdaq-100 bubble to burst or when exactly it might occur, but given the correlation among equity markets, we do not think other markets will remain unscathed if the Nasdaq-100 Index drops sharply. We have previously seen 50% downturns in sharp market corrections, which puts the 20%+ correction of the Nasdaq-100 in 2022 into better perspective. Even a 20% drop in portfolio value could significantly hurt one’s potential retirement income if it happened early into retirement, as it could take several years – at least – to recoup the lost value. In a truly extreme bubble bursting such as what happened in Japan in 1991, the Nikkei took over 30 years to get back to its pre-bubble levels – a devastating impact on wealth. As such, having some downside protection on equity market exposure and/or rotating into fixed income assets before retirement would be a prudent measure given where we see equity valuations today.
Wealth Killer II: Inflation
Over the long term, we believe we have entered a new regime of de-globalization marked by generally higher levels of inflation and less open markets. We’ve argued in the past that the low inflation era of the past two decades is ending as the massive influx of labor from millennials and China being the world’s manufacturer both come to an end. Now we are faced with a shrinking supply of labor as baby boomers are retiring and China enters a demographic bust; it’s possible that India and Africa can make up for the loss of cheaper labor from China, but we have our doubts. Unfortunately, tariffs are only going to make an already bad inflation picture that much worse as tariffs will provide a one-time upward shock to prices that is unlikely to go away. We do think, however, that technological innovation from AI is one factor that could boost productivity and offset some of the inflationary pressure from an aging and shrinking labor force as well as de-globalization.
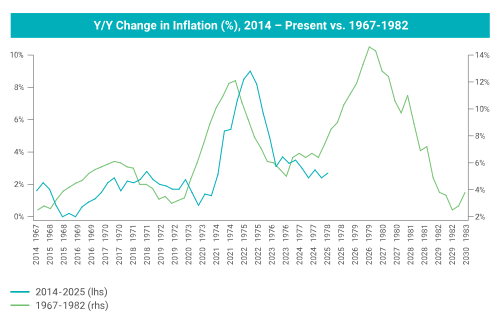
As previously mentioned, the data suggests inflation is still an issue. Over the long term, even small differences in inflation can add up. For example, an annual inflation rate of 3% over 10 years would result in a cumulative loss of purchasing power of 34%, roughly 12% more than if inflation was 2% over 10 years. What is really concerning is the pattern of inflation from 1967 to 1983 compared to the period from 2014 to 2025, as shown in the chart below. Notice a pattern of two inflation peaks between 1967 and 1982. At that time, the U.S. mistakenly thought inflation had been defeated by 1976, but geopolitical events triggered an even bigger spike in inflation that took roughly six years to control. We are not suggesting that inflation will rise back to the extreme levels of the 1970s, but even if inflation rises to half of the 1970s levels in the next decade, the consequences for future purchasing power could be quite negative. That rise in inflation would also have negative ripple effects as the Federal Reserve would be forced to raise interest rates at the very time the U.S. debt load is increasing. We will explore this further in the following section of the next wealth killer. Higher interest rates could also force equity markets and real estate/housing markets to be re-valued lower. In addition, higher inflation would not only reduce future purchasing power but also raise borrowing costs and slow wealth accumulation in assets like equities and real estate.
Inflation may rear its ugly head again
Source: Macrobond
Wealth Killer III: Taxes
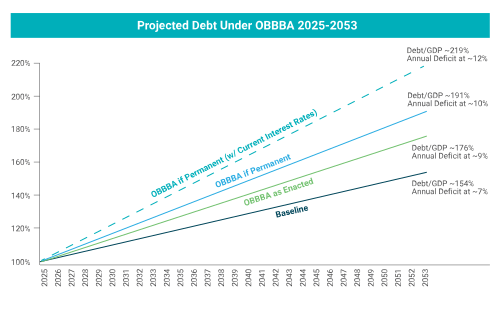
Taxes, the last wealth killer, arises because the U.S. is unfortunately in a period of high debt and deficits that will not improve over the next decade without a sizable shift in fiscal policy. The recent passage of the OBBBA ensures that the U.S. will run deficits between 7-12% annually, implying that over the next two decades, without any changes, the debt/GDP ratio will be 154-219% based on projections from the Committee for a Responsible Federal Budget (CRFB), as seen in the chart below. When one considers that much of the government’s spending goes to mandatory programs like Social Security, Medicare, Medicaid, and interest payments, it is not hard to see that the U.S. will face difficult choices by the 2030s.
U.S. deficits and debt rising sharply over the next few decades
Source: Committee for a Responsible Federal Budget (CRFB)
The difficult debt dynamic is further impacted by two factors. First, the U.S. funds roughly 40% of its debt from foreign buyers. If those buyers lose confidence in the fiscal or monetary strength of the U.S., that will directly translate into a weaker dollar and higher interest costs. Second, the combination of tariffs and an aging workforce points to the possibility of higher inflation as discussed above.
Unfortunately, history shows that addressing high deficits and debt is not easy since there are only a few options for reducing debt: 1) default on it; 2) inflate it away; 3) grow out of it; or 4) pay it off. The U.S. opted for options two and three after debt spiked from World War II, using a combination of high real GDP growth and high inflation to shrink the debt to GDP levels significantly over the course of a few decades. The ability to use high real GDP growth seems more limited for the U.S. given a shrinking labor force due to aging, but perhaps there will be increased productivity from AI. Failing a productivity boom to boost growth, and assuming the U.S. would not default on the debt, that only leaves option two (i.e., inflation) and option four (i.e., paying off the debt) as the only viable options. Using inflation as a long-term strategy to address the U.S. debt seems quite risky given the multiple negative impacts discussed above.
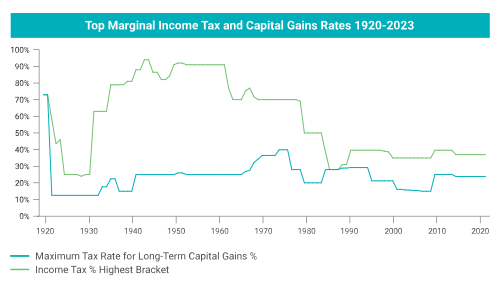
As such, we believe the U.S. will be forced to pay down the debt by reducing budget deficits and perhaps even running budget surpluses. The only way to do that is by increasing revenues and cutting spending. Realistically, politicians are reluctant to cut spending, and over 100% of the U.S. budget deficit is on nondiscretionary items such as Social Security, Medicare, Medicaid, and interest on the national debt. We believe that taxes are likely to rise in the future because there is no other realistic choice. The current highest marginal income tax of 39.6% is quite low compared to the historical average of roughly 58% and well below the peak rate of 94% seen in 1944-1945 during World War II, as displayed in the charts below. Capital gains taxes were the same as the marginal income tax rate of 73% in the 1920s but were cut sharply and have averaged about 25% over the past century, which is very close to the current rate. Nonetheless, there is historical precedent for both income and capital gains taxes to be increased to address the deficit.
Source: Federal Reserve Bank of St. Louis, Congressional Budget Office
But spending cuts and tax increases typically occur only in a crisis situation – and implementing them during a recession would be unwise, as it could only makes things worse. Thus, the notion of “rolling crises” is not one to be dismissed unless there is a significant shift in political behavior. To paraphrase the cynical statement that is often attributed to Winston Churchill: You can always count on Americans to do the right thing, after they’ve tried everything else. As such, we believe a rise in both income taxes and capital gains seems almost inevitable over the next two decades.
The three wealth killers discussed above are not inevitable. We could get lucky and avoid a market correction, a rise in inflation, and/or an increase in taxes. That luck could come in the form of a sharp increase in growth and productivity thanks to AI – growth can cover a number of sins and faults. But, to quote Seneca, “Luck is what happens when preparation meets opportunity.” There is enough advance warning; and with the right planning, we believe the wealth killers we’ve covered can potentially be avoided – or at least mitigated. Ultimately, we can create our own luck. The future of retirement depends on it.
Published Jan 12, 2026
1 Kraft Heinz Lowers Full-Year Outlook on Weak Consumption Trends. The Wall Street Journal, October 29, 2025.
2 The list of major companies laying off staff this year includes Verizon, IBM, Amazon, Starbucks, American Airlines, and more. Business Insider, December 10, 2025.
3 Challenger: 2025 layoffs hit 1M highest since pandemic. United Press International, December 4, 2025.
4 This period had multiple years of positive stock returns after the last year shown; for 1987, 1988, and 1989. The S&P 500 Index returns were 5%, 17%, and 32%, respectively.
5 This period had multiple years of negative stock returns after the last year shown; for 2000, 2001, and 2002. The S&P 500 Index returns were -9%, -12%, and -22%, respectively.
This material has been prepared for informational purposes only and is not intended to provide – and should not be relied on for – tax, legal, or accounting advice; nor is it intended to be relied upon as a forecast, investment research, or investment advice. This material is neither an offer nor a recommendation to buy or sell any financial instrument or security or to adopt any particular investment strategy.
The views in this material are solely and exclusively those of the author(s), are made as of the date of publication, and are subject to change; and we undertake no obligation to update the opinions or the information in this material. Any forward-looking statements contained in this material, including projections and forecasts, may turn out to be wrong. These statements are based on current expectations and the current economic environment and involve a number of risks and uncertainties that are difficult to predict.
Investment involves risk, including possible loss of principal. Past performance does not guarantee future results. Diversification and strategic asset allocation do not guarantee a profit or protect against a loss in declining markets.
Without limiting any of the foregoing and to the extent permitted by law, in no event shall Brighthouse Financial, Inc.; nor any affiliate; nor any of their respective officers, directors, partners, or employees have any liability for (a) any special, punitive, indirect, or consequential damages; or (b) any lost profits, lost revenue, loss of anticipated savings, loss of opportunity, or other financial loss, even if notified of the possibility of such damages, arising from any use of this material or its contents.
This information is for educational purposes only and brought to you courtesy of Brighthouse Financial, Inc., which provides, through its affiliates, annuities and life insurance products issued by Brighthouse Life Insurance Company, Charlotte, NC 28277 and, in New York only, by Brighthouse Life Insurance Company of NY, New York, NY 10017 (“Brighthouse Financial”).
Brighthouse Financial® and its design are registered trademarks of Brighthouse Financial, Inc. and/or its affiliates.
• Not Guaranteed by Any Bank or Credit Union • May Lose Value
- Share :